
Phased Array Ultrasonic Testing (PAUT) Weld Inspection – Pattern Recognition
- Thomas R. Hay, Ph.D., P.E
- Apr 23, 2020
- 5 min read
Introduction
Machines are trained by humans to seek patterns in large volumes of data in order to discriminate between different data types, classes, or categories. A pattern recognition classifier (PRC), an artificial intelligence tool, is trained using data that can be traced back to a given class. Multiple data sets are used to train the PRC to differentiate between classes. This type of generic description applies to any type of information, or data, but how does one apply artificial intelligence and pattern recognition to non-destructive testing or more specifically, phased array ultrasonic testing (PAUT). The practice has been around since the 1980’s but we revisit the importance of input robust data nd principles here for phased array ultrasonic testing of welds. The article summarizes some of the challenges that are being assessed to automated PAUT weld defect classification.
Weld Defects and Phased Array Patterns
Weld defects can be generally categorized as volumetric and planar flaws. Volumetric weld flaws include porosity, slag, and inclusions. Planar weld flaws include lack of fusion (LOF), heat affected zone cracks, center line cracks, base metal cracks, and others. Some examples of weld defects that are routinely found with phased array ultrasonic testing (PAUT) are show in Figure 1.

Figure 1: Weld defects detected by phased array ultrasonic testing (PAUT); slag (top left), root incomplete fusion (top right), center line crack (bottom left), and bevel lack of fusion (bottom right).
Example data, generated using an Olympus MX-2 Omni-scan, from a slag inclusion is shown Figure 2. The data is generated using a 45 – 70 degree shear wave S-scan on a single vee 0.625” thick plate. The phased array A-scan and S-scan are shown on the left and right, respectively. The slag inclusion is detected in the second leg of the scan towards the top of the weld. Multiple individual peaks, or a cluster of blended peaks, may be observed in the A-scan depending on the inclusion shape. Similarly, multiple zones of high intensity reflections are observed in the phased array S-scan.

Figure 2: Phased array ultrasonic testing (PAUT) data from slag inclusion.
Phased array data from a root lack of fusion in a 0.375” thick steel plate is shown in Figure 3. The weld in case is a single vee with a very narrow root gap. An extremely strong corner trap indication at very high intensity is observed at the plate bottom – roughly 0.10 inches from the weld centerline. The focal law cursor in the S-scan is placed at the point of maximum intensity – roughly 90% full screen height (%FSH).Compared to the slag inclusion, this type of defect is detected at excellent signal-to-noise ratio (SNR) and is comparably narrow in width in both the S-scan and A-scan.The excellent SNR is due to the geometry of the corner trap. Ultrasound is reflected efficiently from the sharp corner caused by the root lack of fusion.Interestingly, there is a smaller secondary indication in the S-scan that is traced back to ultrasonic energy traveling up the surface of the LOF and diffracting from the LOF tip.This secondary indication, at lower SNR, is comparable to the crack tip diffraction phenomenon.Also notice, this tip diffraction is located further in time, or distance, as additional time is required to travel up the LOF surface to the tip. In fact, this delay can be measured to accurately provide the height of the LOF in this case.

Figure 3: Phased array ultrasonic testing (PAUT) data from a root lack of fusion
Excellent phased array data from a center line crack is shown in Figure 4. The focal law is centered through the zones of maximum intensity of the crack. In addition to the PAUT indications from the center line crack, additional reflections are observed at the bottom of the single vee weld root and upper weld toe. Compared to the LOF, the crack is detected at significantly lower signal-to-noise ratio. The reflections are a very faint blue corresponding to an amplitude of approximately 20% FSH. The crack tip diffraction phenomenon is clearly observable from both the bottom and top crack tips. Similarly, the PAUT reflections from the crack tip are observable in the A-scan. Like the phased array lack of fusion data presented earlier, the center line crack bottom and top tip diffractions may be used to estimate the crack height. On the Omniscan MX-2, this would be accomplished using the ultrasonic axis reference and measurement cursors, U(m) and U(r).
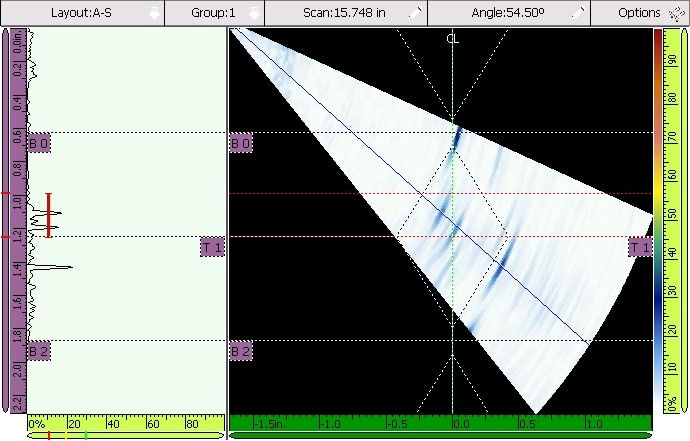
Figure 4: Phased array ultrasonic testing (PAUT) data from a center line crack
Figure 5 shows phased array data from a lack-of-fusion on the weld fusion face. In this case, the weld was a 0.625” thick double vee weld and the PAUT indications align almost perfectly with the weld bevel. The B0 marker identifies the bottom surface of the welded plate. The T1 marker identifies the top surface of the welded plate. Therefore, this PAUT S-scan locates the lack of fusion in the second leg in the upper half of the weld. The width of the lack of fusion in the PAUT S-scan is very narrow. Additionally, compared to the slag inclusion data the LOF is detected at very high signal-to-noise ratio. Similarly, the A-scan data or 51.50 degree focal law, also shows excellent signal-to-noise ratio and is also very narrow.

Figure 5: Phased array ultrasonic testing (PAUT) data from bevel face lack of fusion.
Data Confusion and Spatial Considerations
Figure 6 shows a base metal crack, likely caused from thermal stresses, on the bottom plate surface of a 0.375” thick single vee weld. Like a root lack of fusion, and possibly a root lack of penetration, the base metal crack will reflect phased array ultrasound at excellent signal-to-noise ratio from the corner trap. In this case, the maximum intensity is 90% FSH but in many cases it can eclipse the amplitude range of the display. Also, like the root LOF, there is a lower signal-to-noise ratio crack tip diffraction occurring later in distance due to the travel delay to the crack tip. Naturally, the question arises on how to discriminate between root lack of penetration and base metal crack since there reflection patterns in the PAUT A-scan and S-scan are almost identical. Spatial considerations, among other discriminators, must be adopted into the pattern recognition scheme to discriminate between weld defects originating from significantly different root causes and having potentially drastically different implications on weld performance. Consider, the spatial location data available in the S-scan. The LOP is approximately 0.15” from the centerline while the base metal crack is greater than 0.25” from the weld centerline. A priori knowledge of this information is fundamental to the performance of a reliable pattern recognition classifier.

Figure 6: Phased array ultrasonic testing (PAUT) data from a base metal crack.
Summary
This article reviews PAUT data from a variety of different weld defects and demonstrates that PAUT data visual patterns, related to physical features of the weld defects, may be used to discriminate between the different weld defects. In addition, comparable data from defects originating from different root causes and implications on future weld performance are presented. In this case, the latter must consider spatial considerations, among other parameters, to reliably differential the automation of weld defect classification.


Comments