
FMC/TFM Inspection of Welded Structures
- Thomas R. Hay, Ph.D., P.E., Suhaib Zafar
- Feb 28, 2021
- 5 min read
Updated: Dec 10, 2025
Introduction
Total Focusing Method (TFM) / Full Matrix Capture (FMC) technology show potential to improve weld flaw sizing performance compared to phased array ultrasonic testing (PAUT). TFM is an imaging algorithm that operates on data acquired using FMC data acquisition. TFM/FMC refers to both the data acquisition and processing method used for advanced ultrasonic testing applications. TFM/FMC is a variation of Phased Array Ultrasonic Testing (PAUT and may improve flaw sizing at the expense of inspection speed.
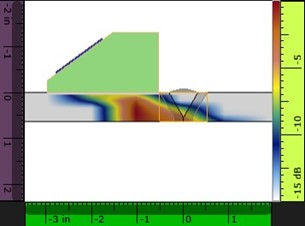
Figure 1: TFM pulse-echo TT wave set acoustic profile in a 0.625” plate.
PAUT involves focusing and steering an acoustic beam at a desired location in the inspected part. The PAUT selling point compared to conventional ultrasonic testing is enhanced scan speed and probability of detection. In addition, flaw sensitivity may also be increased due to depth focusing which improves signal-to-noise (SNR) ratio. Compared to ultrasonic testing, phased array testing can complete a full volumetric weld inspection at one or two index offsets. This is the main feature driving comparably faster PAUT scan speed. The probability of detection (POD) is increased since a broader of spectrum shear wave angles impinges upon the flaw improving the likelihood of detection and sizing accuracy. Where an A-scan is the basic building block for conventional ultrasonic testing, the S-scan is the equivalent for PAUT. The S-scan is built through color coding the individual A-scans of focal laws acquired.
On the contrary, the TFM/FMC does not summarize the data – it is digitized and stored separately. This technique is known as Full Matrix Capture (FMC). FMC works by firing each element individually, and all elements (including the one used for pulsing) act as receivers. All elementary A-scans are then stored as a matrix – thus the acronym FMC. Using this data, a delay law is created for every pixel in the region of interest, also known as the “TFM zone”. This is an advantage over conventional PAUT, where the focalization is applied only at a fixed depth. Consequently, when using TFM/FMC, each pixel has its own focal law focused on its location, thereby improving image resolution. The downside is obvious – since image reconstruction for each pixel in the zone is computationally expensive, obtaining results using TFM/FMC is typically slower than standard PAUT.
It is worth noting that TFM/FMC augments PAUT and is not necessarily a replacement. The major benefit of TFM/FMC over PAUT is the ability to characterize small flaws such as inclusions and porosities thanks to improved image resolution. However, it must be stated that TFM/FMC, like PAUT focusing, only works in the near-field region.
TFM/FMC Inspection of a Welded Plate
As an introduction to the nuances of TFM/FMC, a short case study on the inspection of welded joint commonly found in hydraulic steel structures is presented. The butt joint is single-V groove weld with a base metal thickness is 0.625”. To inspect this weld for various defects, which include (but not limited to) longitudinal cracking, transverse cracking, toe and root cracks, a minimum of two pulse-echo TMF wave sets are required: TT and TTTT.
The T in TT and TTTT refers to the transverse, or shear wave. These wave sets are operated in pulse-echo wherein the transmitted and the received beam follow the same path in the inspection part. Thus, TT and TTTT refer to each leg of the propagation path of the acoustic wave.
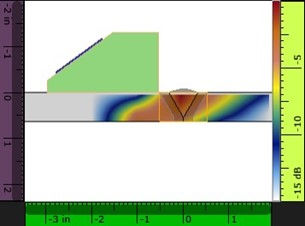
Figures 1 and 2 show the acoustic influence map (AIM) model of TFM/FMC sound field in the inspected joint for the TT and TTTT wave sets. Respectively The acoustic influence map and is a modeling tool available in the Olympus OmniScan™ X3 flaw detector for use with the built-in scan plan tool. The zone of interest for TFM/FMC is shown as an orange box around the V-shaped weld and is configurable by the user as required.
By comparing the two simulations, it can be seen that the TTTT wave set provides better coverage of the weld overall. The TT wave set on the other hand, can only provide reasonable coverage at the root, not the upper half. The AIM tool also measures a sensitivity index (SI), which allows comparison of one AIM with the other(s). In the above figure, the SI for the TT wave set was found to be 22.21, and 19.60 for the TTTT. A higher sensitivity implies a better signal-to-noise ratio (SNR) for areas in the TFM/FMC inspection. With the given numbers, there is no significant difference between the TT and TTTT wave sets, however, the TTTT was chosen for the TFM/FMC inspection of the T-joint due to better coverage (indicated by red and orange colors in the AIM).
TFM/FMC Instrumentation Settings
Various factors need to be kept in mind when setting up a scan plan for a TFM/FMC inspection. The most important ones are listed and described below:
TFM Amplitude Fidelity: Compliance with the ASME code for weld inspection needs to be ensured. The Amplitude Fidelity (AF) should not exceed 2 dB.
TFM Zone: The TFM zone should be 1.1X the desired area to accommodate for index offset material offset error. An example TFM zone with excellent acoustic field intensity is shown in Figure 3.
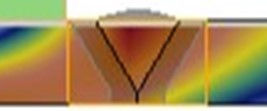
Figure 3 TFM zone encompassing entire weld area.
TFM Resolution: The TFM resolution should satisfy the defect sizing objectives of the inspection. The resolution is the distance between 2 consecutive TFM points. TFM zones usually have a lower- and upper-point quantity that influence resolution and amplitude fidelity (AF) and may differ between instrument manufacturers. Setting the resolution too fine can have a significant impact on the acquisition speed, and in the worst case, make scanning impossible.
TFM Acquisition Rate: The acquisition rate should be set such that all the data collected is kept and displayed. The acquisition rate is the number of complete acquisition cycles expressed in Hz added to the time required to convert the FMC signal to the resulting TFM wave set. If the acquisition rate is too high, two possibilities may occur: (i) No data lost but the display cannot keep up with the acquisition; (ii) Data is lost, which typically indicates that the scanner is moving too fast compared to the acquisition rate.
Summary
In this article, we introduced the TFM/FMC technology which is a recent addition to the list of NDT methods used in the industry. TFM/FMC is a variation of the PAUT in terms of data acquisition and processing. The most significant advantage of TFM/FMC over PAUT is the ability to reproduce better resolution images. This benefit comes with the downside of a slower data acquisition due to real-time intense processing power required. Various wave sets can be utilized when using the TFM/FMC for part inspections. In this article, we presented a case study of a welded steel joint specimen from a welded steel structure, comparing the TT and TTTT wave sets. For this specimen, the TTTT wave set performed better, using the acoustic field coverage metric.


Comments